Ofsted
Ofsted is the Office for Standards in Education, Children’s Services and Skills. Ofsted regulate and inspect schools and colleges to seek improvement in the service. They carry out a large number of inspections and regulatory visits in England and publish their finding on their website.
Our latest Ofsted inspection was carried out in February 2019.
10086831 Stanley (Crook) Primary School 114059 PDF Final
Our school inspection reports are also available to view here: Stanley Crook Primary School latest Ofsted report
Please click the links below to view our response to the outcomes of our school’s most recent inspection – as well as actions we have taken to address the recommendations made by Ofsted of improving teaching and learning towards outstanding and improving the effectiveness of leadership and governance.
Cover letter to parents Ofsted report
Summary of Progress against Ofsted Areas for Improvement since last inspection (July 2023 updates)
Department for Education
Many Parents are keen to see how we are performing in relation to other schools.
The Department for Education (DfE) Performance Tables provide a reliable and accessible source of comparative information on pupil attainment and progress, absence, workforce and finance. You can find the School Performance Tables from the DfE by clicking the link below.
You can view the Stanley Crook Primary School Performance Tables on the Department of Education website.
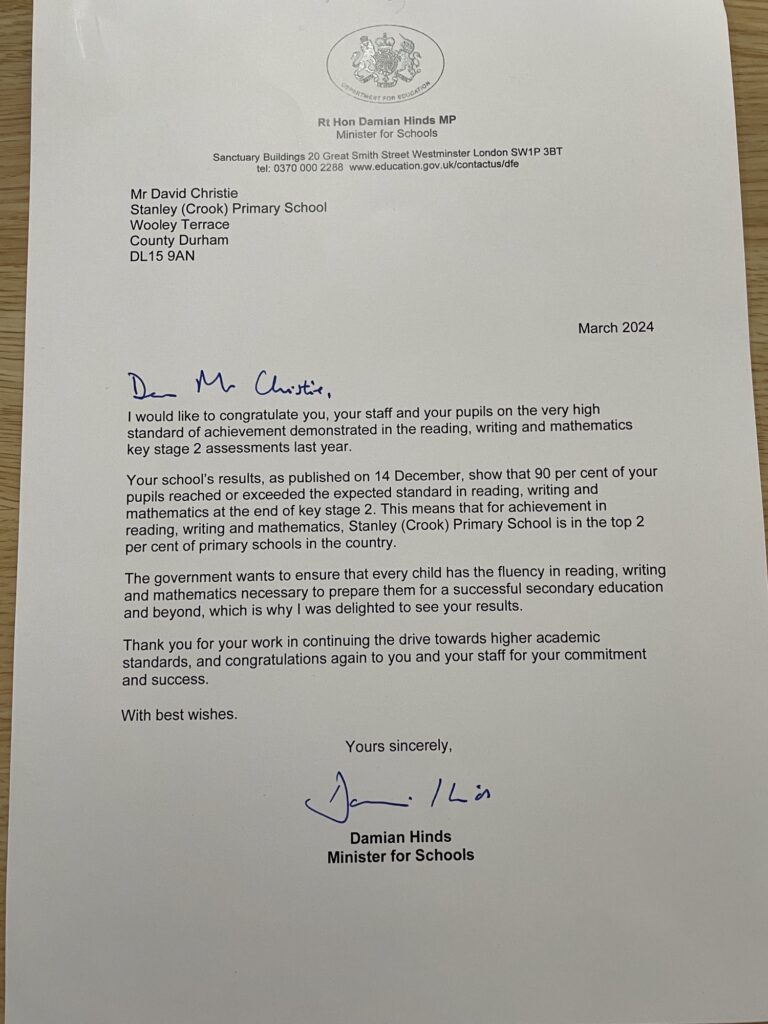
Everyone in school was extremely pleased to receive a letter from Rt. Hon. Damien Hinds MP and Minister for Schools, in which he congratulated children and staff on the outstanding outcomes in Key Stage 2 assessments in 2023.
School Performance and Pupil Outcomes 2023
Every member of our school community is extremely proud of the efforts of children in school!
As was the case in 2022, results for 2023 again evidence pupil outcomes which are higher than both local and national projected and provisional outcomes. The efforts of staff and everyone associated with school has been outstanding in our collective determination to reduce the adverse impact of the COVID pandemic on children’s learning and achievement. The effectiveness and success of the school Curriculum Recovery Strategy (September 2020 – July 2022) has enabled children to recover learning lost due to the pandemic and evidence outstanding achievement across the curriculum – both within academic and personal, social and emotional aspects of learning.
Please view our school’s outstanding results from 2023:
School Performance – Overview 2023
| 2023 Statutory Assessments | School – All Pupils | National | ||
| Expected + (%) | Greater Depth/ Higher Standard (%) | Expected + (%) | Greater Depth/ Higher Standard (%) | |
| EYFS GLD | 72 | NA | 65* | NA |
| Year 1 PSC | 89 | NA | 79 | NA |
| Year 2 PSC | 100 | NA | 89 | NA |
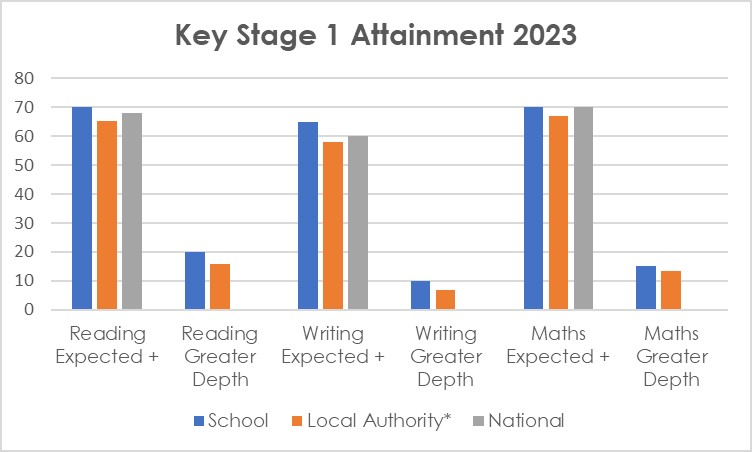
| KS1 – Reading | 70 | 15 | 68 | 19 |
| KS1 – Writing | 65 | 10 | 60 | 8 |
| KS1 – Maths | 70 | 15 | 70 | 16 |
| Year 4 Multiplication Tables Check | 16 pupils above 19/25 marks | NA | NA | |
| KS2 – Reading | 100 | 75 | 73 | 29 |
| KS2 – Writing | 90 | 25 | 71 | 13 |
| KS2 – Maths | 100 | 70 | 73 | 24 |
| KS2 – EGPS | 100 | 35 | 72 | 30 |
| KS2 – Reading, Writing and Maths (combined) | 90 | 25 | 59 | 8 |
*2022 outcome
Reception Results (Foundation Stage Profile) 2023
| FSP % Achieving at least Expected Standard (Gender) | School – 2023 (based on National – 2022) | ||||||||
| School | NAT | ||||||||
| All | Boys | Girls | All | Boys | Girls | ||||
| Cohort | 18 | 9 | 9 | 0 | – | – | |||
| Listening, attention, understanding | 100 | 100 | 100 | 82 | 77 | 87 | |||
| Speaking | 94 | 89 | 100 | 83 | 78 | 87 | |||
| Self-regulation | 94 | 89 | 100 | 85 | 80 | 91 | |||
| Managing self | 89 | 78 | 100 | 87 | 82 | 92 | |||
| Building relationships | 94 | 89 | 100 | 89 | 84 | 93 | |||
| Gross motor skills | 94 | 89 | 100 | 92 | 89 | 95 | |||
| Fine motor skills | 94 | 89 | 100 | 86 | 79 | 93 | |||
| Comprehension | 94 | 89 | 100 | 80 | 76 | 85 | |||
| Word reading | 89 | 78 | 100 | 75 | 70 | 79 | |||
| Writing | 72 | 56 | 89 | 70 | 64 | 76 | |||
| Number | 78 | 67 | 89 | 78 | 76 | 80 | |||
| Numerical patterns | 78 | 67 | 89 | 77 | 75 | 80 | |||
| Past and present | 100 | 100 | 100 | 82 | 78 | 86 | |||
| People, culture and communities | 83 | 78 | 89 | 81 | 77 | 86 | |||
| The natural world | 100 | 100 | 100 | 85 | 82 | 89 | |||
| Creating with materials | 94 | 89 | 100 | 87 | 82 | 93 | |||
| Being imaginative & expressive | 94 | 89 | 100 | 87 | 81 | 92 | |||
| GLD | 72 | 56 | 89 | 65 | 59 | 72 | |||
| CL+R+W | 72 | 56 | 89 | ||||||
% of children achieving a Good Level of Development in 2023 – 72% (65% National – based on 2022 outcomes)
Phonics Screening Check (Year 1) 2023
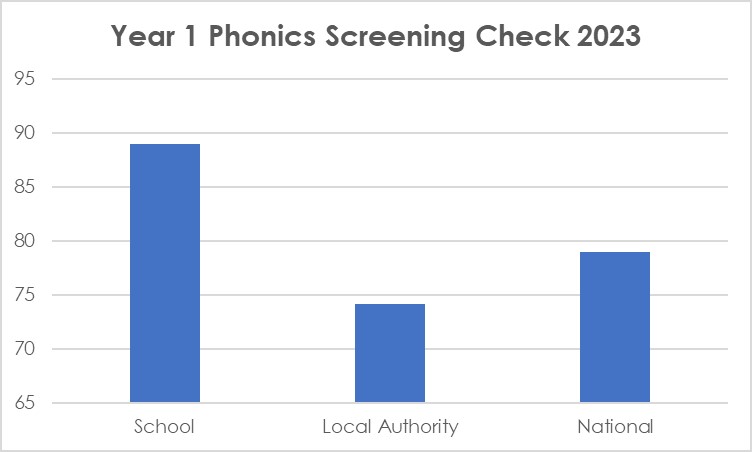
89.5% of children meeting threshold (32 marks) for phonics screening (68% of cohort met ELGs for Reading at end of Reception 2022).
7/9 boys met phonics threshold (up from 5/9 boys who met ELG for Reading at end of Reception 2022).
10/10 girls met phonics threshold (up from 8/10 girls who met ELG for Reading at end of Reception 2022).
Phonics Screening Check (Year 2 resits) 2023
1 child completed Y2 PSC resit and met threshold.
By the end of Year 2, 100% of children met threshold for phonics screening (89% national)in 2023.
Year 2 Results 2023
Year 6 Results 2023
Year 6 KS2 Comparative Results Report 2023
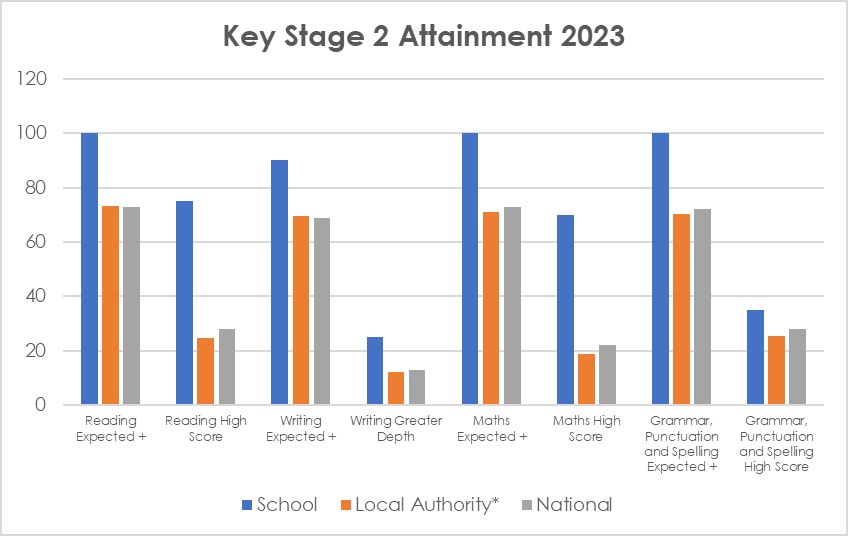
*Local Authority outcomes based on 2022 results
Progress Scores KS2 2023
Reading progress score (confidence interval in brackets): 5.0 (2.3 to 7.8)
Writing TA progress score (confidence interval in brackets): 1.6 (-1.1 to 4.2)
Mathematics progress score (confidence interval in brackets): 5.1 (2.5 to 7.7)
School Results tables (including phonics) 2023
ARCHIVE
EYFS – Good Level of Development
| 2022 EYFS GLD (%) | ||
| School | Local Authority | National |
| 68.4 | 64.5 | 65.2 |
Phonics
| Year 1 Phonics (%) | ||
| School | Local Authority | National |
| 95 | 74.2 | 75.5 |
Key Stage 1
| Key Stage 1 Attainment (%) | ||||||
| Reading Expected + | Reading Greater Depth | Writing Expected + | Writing Greater Depth | Maths Expected + | Maths Greater Depth | |
| School | 76.5 | 23.5 | 76.5 | 17.6 | 76.5 | 17.6 |
| Local Authority | 65.2 | 15.7 | 58 | 6.9 | 67 | 13.3 |
| National | 66.9 | 18 | 57.6 | 8 | 67.7 | 15.1 |
Key Stage 2
| Key Stage 2 Provisional Attainment (%) | ||||||||
| Reading Expected + | Reading High Score | Writing Expected + | Writing Greater Depth | Maths Expected + | Maths High Score | Grammar, Punctuation and Spelling Expected + | Grammar, Punctuation and Spelling High Score | |
| School | 89 | 72.2 | 84 | 11 | 94 | 16.7 | 89 | 33.3 |
| Local Authority | 73.1 | 24.8 | 69.4 | 12.4 | 70.9 | 18.8 | 70.4 | 25.3 |
| National | 74 | 28 | 69 | 13 | 71 | 22 | 72 | 28 |
| Key Stage 2 Combined Attainment | ||
| Reading, Writing and Maths – Expected + | Reading, Writing and Maths – High Score | |
| School | 84 | 6 |
| Local Authority | 57.4 | 5.9 |
| National | 59 | 7.2 |
Childcare Provision
Stanley Crook Primary offer childcare provision and wraparound care. Full details of the provision provided can be found on our Childcare Provision section of our website.
Check School Performance Tables
You can use performance tables (sometimes known as league tables) to compare schools and colleges in your area. You can check:
- exam and test results
- financial information
- Ofsted reports
You can only see statistics for schools and colleges in England.
Adobe Reader
You may need a product like Adobe Reader (free download) to view our PDF documents on our website.


